Xente Fraud Classification Challenge on Zindi
How a data scientist used datasist to quickly prototype a solution in a data science competition
Link to the competition page where you can get the dataset and also better understand the problem.
Data Overview
Quick summary of a data set using the describe function in the structdata module
First five data points
TransactionId | BatchId | AccountId | SubscriptionId | CustomerId | CurrencyCode | CountryCode | ProviderId | ProductId | ProductCategory | ChannelId | Amount | Value | TransactionStartTime | PricingStrategy | FraudResult | |
0 | TransactionId_76871 | BatchId_36123 | AccountId_3957 | SubscriptionId_887 | CustomerId_4406 | UGX | 256 | ProviderId_6 | ProductId_10 | airtime | ChannelId_3 | 1000.0 | 1000 | 2018-11-15T02:18:49Z | 2 | 0 |
1 | TransactionId_73770 | BatchId_15642 | AccountId_4841 | SubscriptionId_3829 | CustomerId_4406 | UGX | 256 | ProviderId_4 | ProductId_6 | financial_services | ChannelId_2 | -20.0 | 20 | 2018-11-15T02:19:08Z | 2 | 0 |
2 | TransactionId_26203 | BatchId_53941 | AccountId_4229 | SubscriptionId_222 | CustomerId_4683 | UGX | 256 | ProviderId_6 | ProductId_1 | airtime | ChannelId_3 | 500.0 | 500 | 2018-11-15T02:44:21Z | 2 | 0 |
3 | TransactionId_380 | BatchId_102363 | AccountId_648 | SubscriptionId_2185 | CustomerId_988 | UGX | 256 | ProviderId_1 | ProductId_21 | utility_bill | ChannelId_3 | 20000.0 | 21800 | 2018-11-15T03:32:55Z | 2 | 0 |
4 | TransactionId_28195 | BatchId_38780 | AccountId_4841 | SubscriptionId_3829 | CustomerId_988 | UGX | 256 | ProviderId_4 | ProductId_6 | financial_services | ChannelId_2 | -644.0 | 644 | 2018-11-15T03:34:21Z | 2 | 0 |
Last five data points
TransactionId | BatchId | AccountId | SubscriptionId | CustomerId | CurrencyCode | CountryCode | ProviderId | ProductId | ProductCategory | ChannelId | Amount | Value | TransactionStartTime | PricingStrategy | FraudResult | |
95657 | TransactionId_89881 | BatchId_96668 | AccountId_4841 | SubscriptionId_3829 | CustomerId_3078 | UGX | 256 | ProviderId_4 | ProductId_6 | financial_services | ChannelId_2 | -1000.0 | 1000 | 2019-02-13T09:54:09Z | 2 | 0 |
95658 | TransactionId_91597 | BatchId_3503 | AccountId_3439 | SubscriptionId_2643 | CustomerId_3874 | UGX | 256 | ProviderId_6 | ProductId_10 | airtime | ChannelId_3 | 1000.0 | 1000 | 2019-02-13T09:54:25Z | 2 | 0 |
95659 | TransactionId_82501 | BatchId_118602 | AccountId_4841 | SubscriptionId_3829 | CustomerId_3874 | UGX | 256 | ProviderId_4 | ProductId_6 | financial_services | ChannelId_2 | -20.0 | 20 | 2019-02-13T09:54:35Z | 2 | 0 |
95660 | TransactionId_136354 | BatchId_70924 | AccountId_1346 | SubscriptionId_652 | CustomerId_1709 | UGX | 256 | ProviderId_6 | ProductId_19 | tv | ChannelId_3 | 3000.0 | 3000 | 2019-02-13T10:01:10Z | 2 | 0 |
95661 | TransactionId_35670 | BatchId_29317 | AccountId_4841 | SubscriptionId_3829 | CustomerId_1709 | UGX | 256 | ProviderId_4 | ProductId_6 | financial_services | ChannelId_2 | -60.0 | 60 | 2019-02-13T10:01:28Z | 2 | 0 |
Shape of data set: (95662, 16)
Size of data set: 1530592
Data Types
Note: All Non-numerical features are identified as objects in pandas
Data Type | |
TransactionId | object |
BatchId | object |
AccountId | object |
SubscriptionId | object |
CustomerId | object |
CurrencyCode | object |
CountryCode | int64 |
ProviderId | object |
ProductId | object |
ProductCategory | object |
ChannelId | object |
Amount | float64 |
Value | int64 |
TransactionStartTime | object |
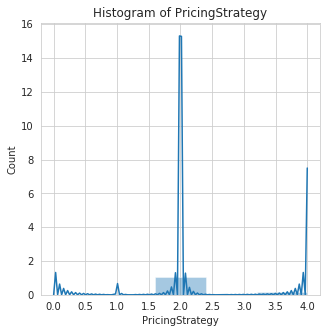
PricingStrategy | int64 |
FraudResult | int64 |
Column(s) {'TransactionStartTime'} should be in Datetime format. Use the [to_date] function in datasist.feature_engineering to coonvert to Pandas Datetime format
Numerical Features in Data set
['CountryCode', 'Amount', 'Value', 'PricingStrategy', 'FraudResult']
Statistical Description of Columns
CountryCode | Amount | Value | PricingStrategy | FraudResult | |
count | 95662.0 | 9.566200e+04 | 9.566200e+04 | 95662.000000 | 95662.000000 |
mean | 256.0 | 6.717846e+03 | 9.900584e+03 | 2.255974 | 0.002018 |
std | 0.0 | 1.233068e+05 | 1.231221e+05 | 0.732924 | 0.044872 |
min | 256.0 | -1.000000e+06 | 2.000000e+00 | 0.000000 | 0.000000 |
25% | 256.0 | -5.000000e+01 | 2.750000e+02 | 2.000000 | 0.000000 |
50% | 256.0 | 1.000000e+03 | 1.000000e+03 | 2.000000 | 0.000000 |
75% | 256.0 | 2.800000e+03 | 5.000000e+03 | 2.000000 | 0.000000 |
max | 256.0 | 9.880000e+06 | 9.880000e+06 | 4.000000 | 1.000000 |
Categorical Features in Data set
['TransactionId',
'BatchId',
'AccountId',
'SubscriptionId',
'CustomerId',
'CurrencyCode',
'ProviderId',
'ProductId',
'ProductCategory',
'ChannelId',
'TransactionStartTime']
Unique class Count of Categorical features
Feature | Unique Count | |
0 | TransactionId | 95662 |
1 | BatchId | 94809 |
2 | AccountId | 3633 |
3 | SubscriptionId | 3627 |
4 | CustomerId | 3742 |
5 | CurrencyCode | 1 |
6 | ProviderId | 6 |
7 | ProductId | 23 |
8 | ProductCategory | 9 |
9 | ChannelId | 4 |
10 | TransactionStartTime | 94556 |
Missing Values in Data
features | missing_counts | missing_percent | |
0 | TransactionId | 0 | 0.0 |
1 | BatchId | 0 | 0.0 |
2 | AccountId | 0 | 0.0 |
3 | SubscriptionId | 0 | 0.0 |
4 | CustomerId | 0 | 0.0 |
5 | CurrencyCode | 0 | 0.0 |
6 | CountryCode | 0 | 0.0 |
7 | ProviderId | 0 | 0.0 |
8 | ProductId | 0 | 0.0 |
9 | ProductCategory | 0 | 0.0 |
10 | ChannelId | 0 | 0.0 |
11 | Amount | 0 | 0.0 |
12 | Value | 0 | 0.0 |
13 | TransactionStartTime | 0 | 0.0 |
14 | PricingStrategy | 0 | 0.0 |
15 | FraudResult | 0 | 0.0 |
Remove features that contains only one unique field as these features are redundant
Check for missing values in dataset with the display function
Data Exploration
['TransactionId',
'BatchId',
'AccountId',
'SubscriptionId',
'CustomerId',
'ProviderId',
'ProductId',
'ProductCategory',
'ChannelId',
'TransactionStartTime']
Feature | Unique Count | |
0 | TransactionId | 95662 |
1 | BatchId | 94809 |
2 | AccountId | 3633 |
3 | SubscriptionId | 3627 |
4 | CustomerId | 3742 |
5 | ProviderId | 6 |
6 | ProductId | 23 |
7 | ProductCategory | 9 |
8 | ChannelId | 4 |
9 | TransactionStartTime | 94556 |
From the unique display output, we notice that the TransactionId and BatchId contains too many classes and thus we can drop them.
Visualization of Categorical Features
Unique Values in AccountId is too large to plot
Unique Values in SubscriptionId is too large to plot
Unique Values in CustomerId is too large to plot
Unique Values in TransactionStartTime is too large to plot
Unique classes in AccountId too large
Unique classes in SubscriptionId too large
Unique classes in CustomerId too large
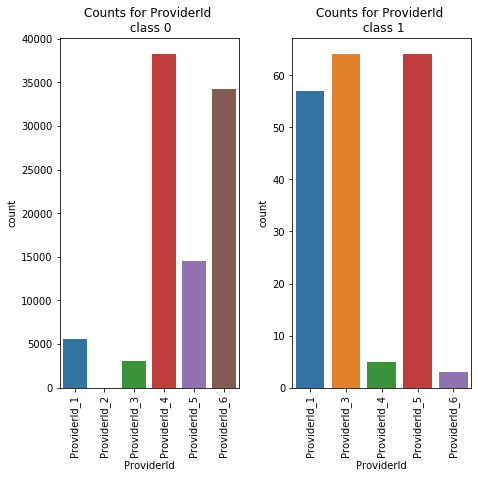
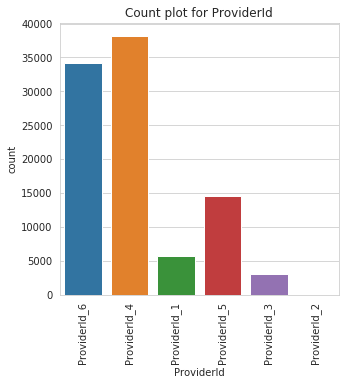
Class Count for ProviderId
ProviderId | |
ProviderId_4 | 38189 |
ProviderId_6 | 34186 |
ProviderId_5 | 14542 |
ProviderId_1 | 5643 |
ProviderId_3 | 3084 |
ProviderId_2 | 18 |
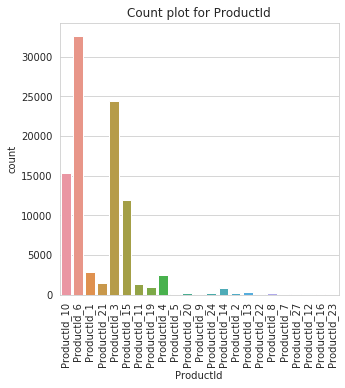
Unique classes in ProductId too large
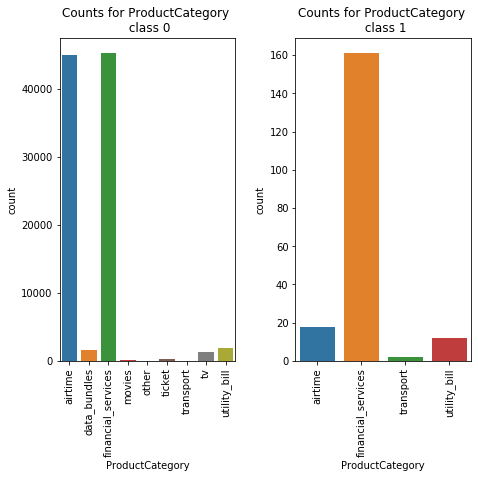
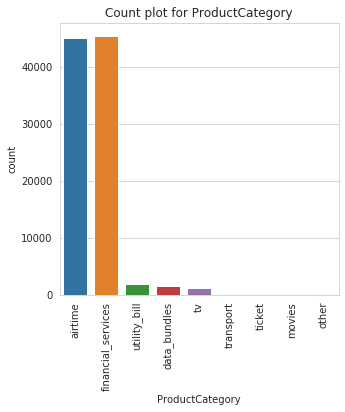
Class Count for ProductCategory
ProductCategory | |
financial_services | 45405 |
airtime | 45027 |
utility_bill | 1920 |
data_bundles | 1613 |
tv | 1279 |
ticket | 216 |
movies | 175 |
transport | 25 |
other | 2 |
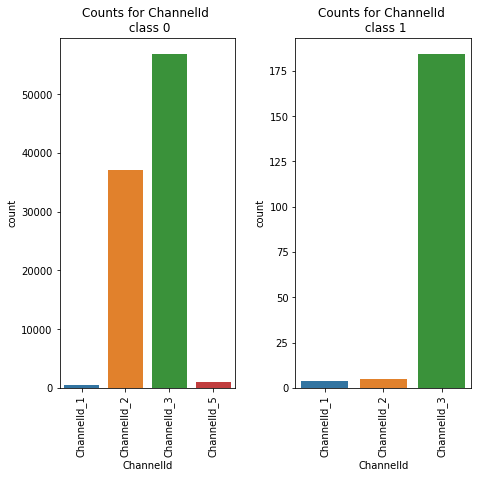
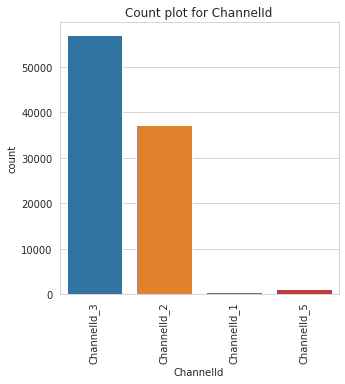
Class Count for ChannelId
ChannelId | |
ChannelId_3 | 56935 |
ChannelId_2 | 37141 |
ChannelId_5 | 1048 |
ChannelId_1 | 538 |
Unique classes in TransactionStartTime too large
Index(['AccountId', 'SubscriptionId', 'CustomerId', 'ProviderId', 'ProductId',
'ProductCategory', 'ChannelId', 'Amount', 'Value',
'TransactionStartTime', 'PricingStrategy', 'FraudResult'],
dtype='object')
TransactionId feature has too many categories and will not be ploted
BatchId feature has too many categories and will not be ploted
AccountId feature has too many categories and will not be ploted
SubscriptionId feature has too many categories and will not be ploted
CustomerId feature has too many categories and will not be ploted
ProductId feature has too many categories and will not be ploted
TransactionStartTime feature has too many categories and will not be ploted
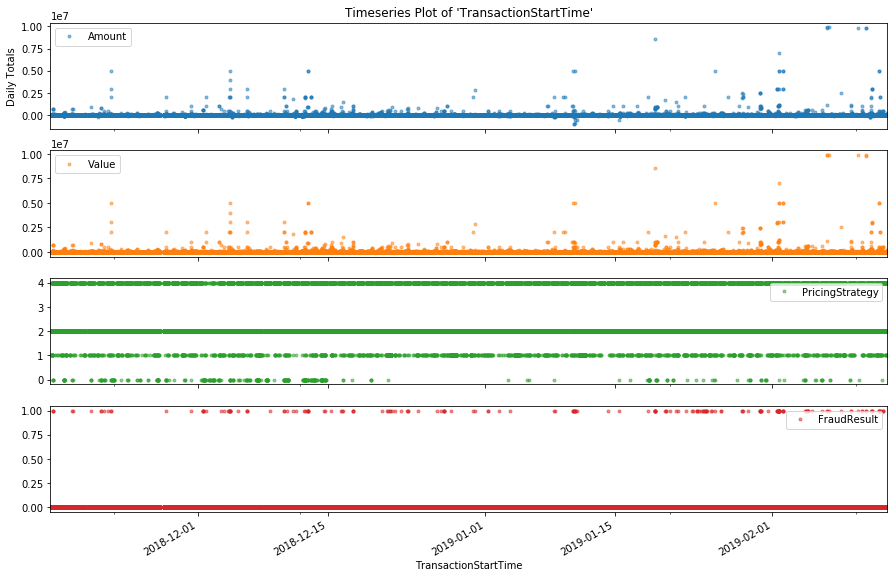
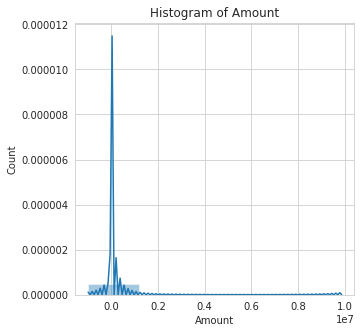
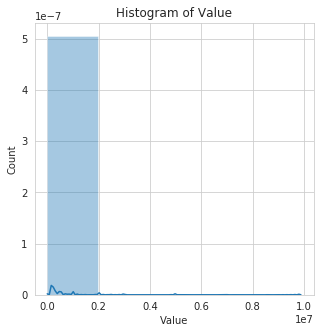
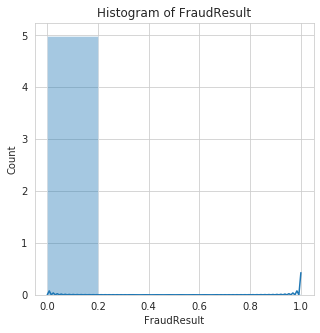
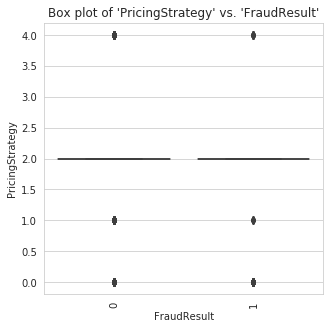
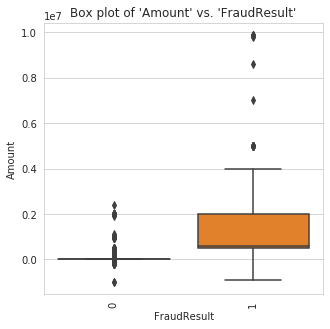
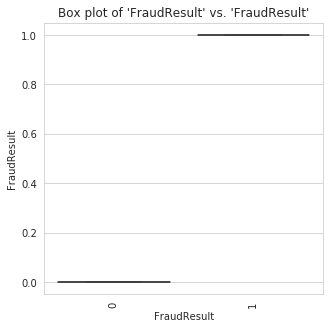
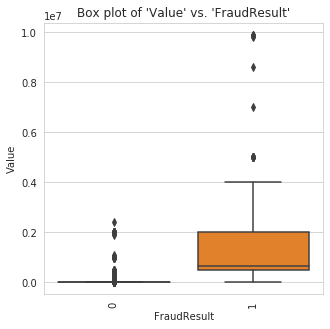
Visualization of Numerical Features
Working on Time Feature
{'TransactionStartTime'}
TransactionStartTime | |
0 | 2018-11-15T02:18:49Z |
1 | 2018-11-15T02:19:08Z |
2 | 2018-11-15T02:44:21Z |
3 | 2018-11-15T03:32:55Z |
4 | 2018-11-15T03:34:21Z |
The extract_dates function in the timeseries module can extract date information from a datetime column automatically.
0 | 1 | |
AccountId | AccountId_3957 | AccountId_4841 |
SubscriptionId | SubscriptionId_887 | SubscriptionId_3829 |
CustomerId | CustomerId_4406 | CustomerId_4406 |
ProviderId | ProviderId_6 | ProviderId_4 |
ProductId | ProductId_10 | ProductId_6 |
ProductCategory | airtime | financial_services |
ChannelId | ChannelId_3 | ChannelId_2 |
Amount | 1000 | -20 |
Value | 1000 | 20 |
PricingStrategy | 2 | 2 |
FraudResult | 0 | 0 |
TransactionStartTime_dow | Thursday | Thursday |
TransactionStartTime_doy | 319 | 319 |
TransactionStartTime_dom | 15 | 15 |
TransactionStartTime_hr | 2 | 2 |
TransactionStartTime_min | 18 | 19 |
TransactionStartTime_is_wkd | 0 | 0 |
TransactionStartTime_yr | 2018 | 2018 |
TransactionStartTime_qtr | 4 | 4 |
TransactionStartTime_mth | 11 | 11 |
Merge Data and Encode Categorical Features
Modeling
Train two classifiers and get detailed report with the datasist classification report function.
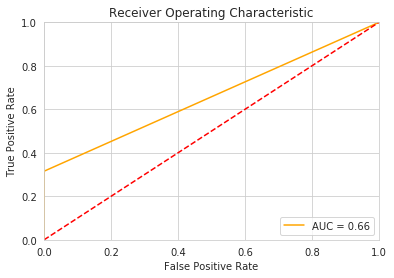
Accuracy is 100.0
F1 score is 41.0
Precision is 58.0
Recall is 32.0
****************************************************************************************************
confusion Matrix
Score positive Score negative
Actual positive 28629 13
Actual negative 39 18
In [94]:
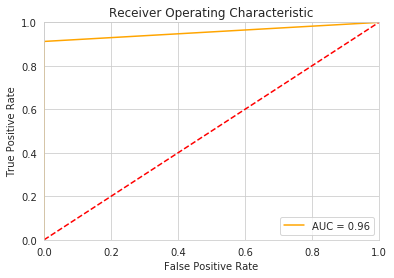
Accuracy is 100.0
F1 score is 90.0
Precision is 90.0
Recall is 91.0
****************************************************************************************************
confusion Matrix
Score positive Score negative
Actual positive 28636 6
Actual negative 5 52
From the metrics reported, we can see that the RandomForest model does better than then Logistic Regression model. Next we can use a cross validation function to detect overfitting.
Accuracy is 99.8787
F1_score is 72.1679
Precision is 76.2845
Recall is 79.7035
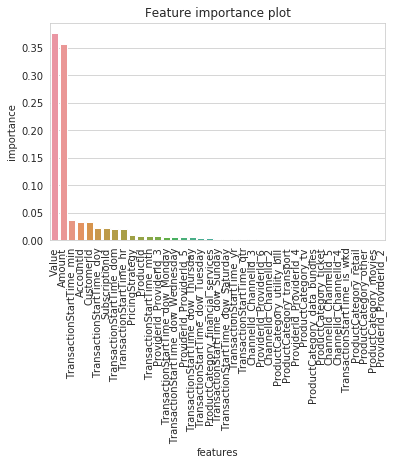
Finally, we can plot the feature importance to see the most important features.
Download Notebook Full Notebook Here
Last updated