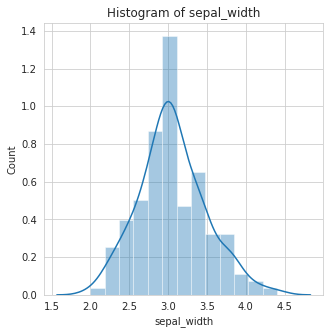
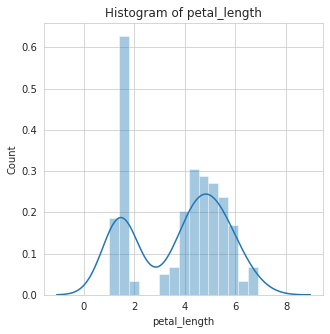
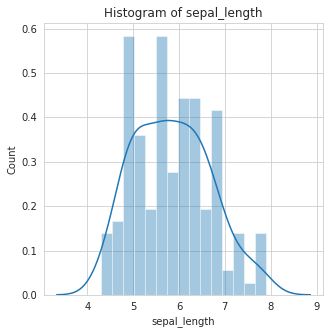
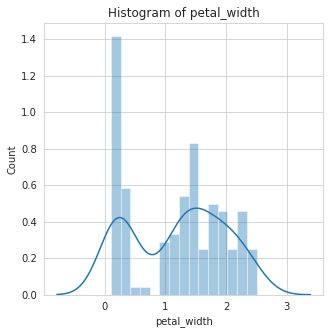
Makes an histogram plot of all numerical features. Helps to show uni-variate distribution of the features.
histogram(data=None, num_features=None, bins=None, show_dist_type=False, fig_size=(5,5), save_fig=False):''' Parameters ------------ data : DataFrame, array, or list of arrays. Dataset for plotting. num_features: Scalar, array, or list. The numerical features in the dataset, if not None, we try to infer the numerical columns from the dataframe. bins: int The number of bins to use. show_dist_type: bool, Default False If True, Calculates the skewness of the data and display one of (Left skewed, right skewed or normal) fig_size: tuple, Default (8,8). The size of the figure object. save_fig: bool, Default False. If True, saves the current plot to the current working directory '''
Examples
We are using the classic iris data set and a Jupyter notebook in the following examples.
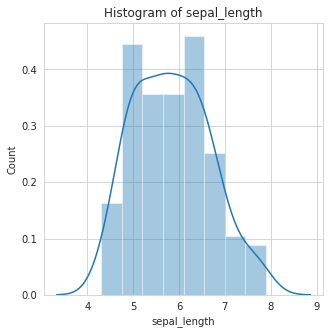
An histogram can be created for every column in a DataFrame:
import pandas as pdimport datasist as ds #import datasist librarydf = pd.read_csv('iris.csv')vs.histogram(data=df)
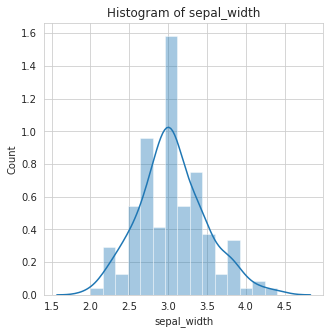
A bin can specified when plotting an histogram:
vs.histogram(data=df, bins=15)
To improve this documentation, visit the datasist-doc repository