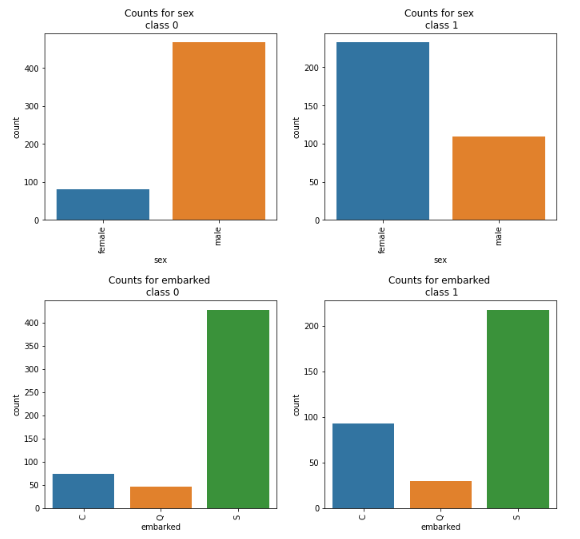
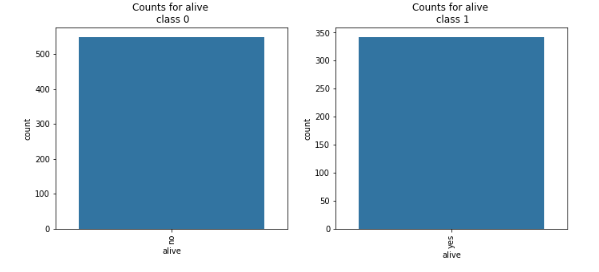
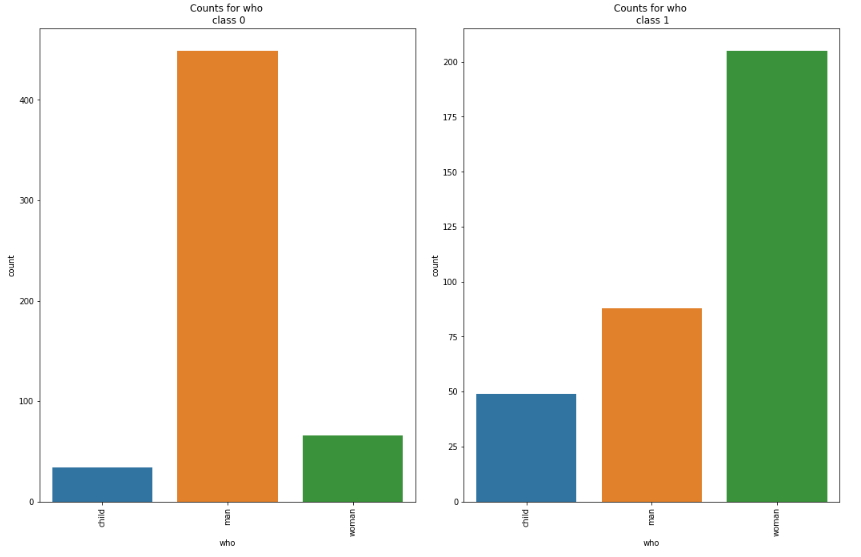
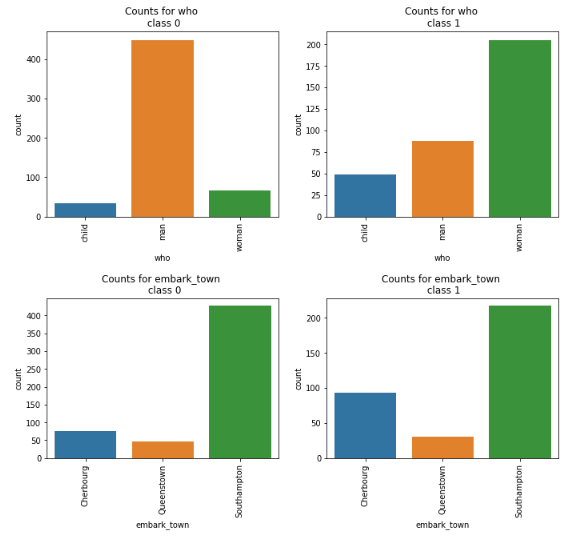
Makes a side by side bar plot of all categorical features against a categorical target feature.
catbox(data=None, cat_features=None, target=None, fig_size=(10,5), save_fig=False):''' Parameters ------------ data: DataFrame, array, or list of arrays. Dataset for plotting. cat_features: Scalar, array, or list. The categorical features in the dataset, if None, we try to infer the categorical columns from the dataframe. target: Scalar, array or list. Categorical target to plot against. fig_size: tuple, Default (12,6) The size of the figure object. save_fig: bool, Default False. If True, saves the plot to the current working directory. '''
Examples
We are using the titanic data set and a Jupyter notebook in the following examples.
catbox can be created for every categorical column in a DataFrame:
import pandas as pdimport datasist.visualizations as vsdf = pd.read_csv('titanic.csv')vs.catbox(data=df, target='survived')
catbox can be created for specified categorical column only: