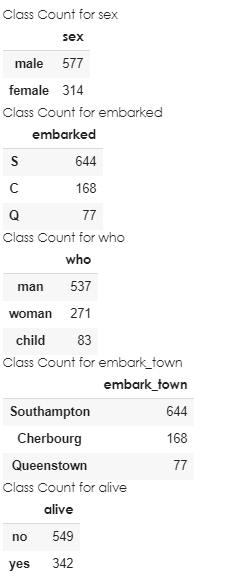
Displays the number of classes in a categorical feature.
class_count(data=None, features=None, plot=False, save_fig=False):''' Parameters ------------ data: Pandas DataFrame or Series Dataset for plotting. features: Scalar, array, or list. The categorical features in the dataset, if None, we try to infer the categorical columns from the dataframe. plot: bool, Default False. Plots the class counts as a barplot save_fig: bool, Default False. Saves the plot to the current working directory. '''
Examples
We are using the titanic data set and a Jupyter notebook in the following examples.
class_count can be created for every categorical column in a DataFrame:
import pandas as pdimport datasist.visualizations as vsdf = pd.read_csv('titanic.csv')vs.class_count(data=df)