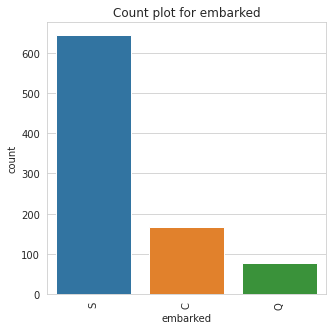
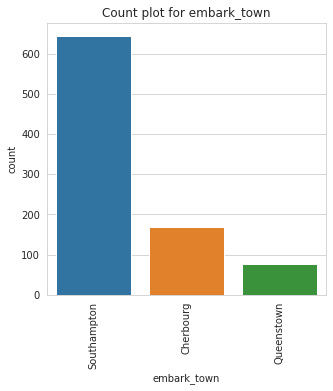
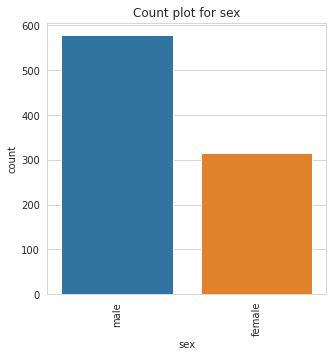
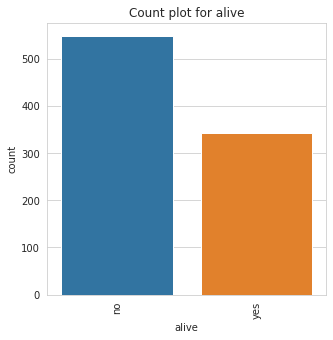
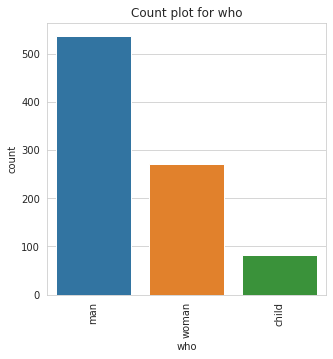
Makes a bar plot of all categorical features to show their counts.
countplot(data=None, features=None, separate_by=None, fig_size=(5,5), save_fig=False):''' Parameters ------------ data : DataFrame, array, or list of arrays. The data to plot. features: str, scalar, array, or list. The categorical features in the dataset, if not provided, we try to infer the categorical columns from the dataframe. separate_by: str, default None. The feature used to seperate the plot. Called hue in seaborn. fig_size: tuple, Default (5,5) The size of the figure object. save_fig: bool, Default False. Saves the plot to the current working directory '''
Examples
We are using the titanic data set and a Jupyter notebook in the following examples.
Countplot can be created for every categorical column in a DataFrame:
import pandas as pdimport datasist.visualizations as vsdf = pd.read_csv('titanic.csv')vs.countplot(data=df)