plot_missing

Description

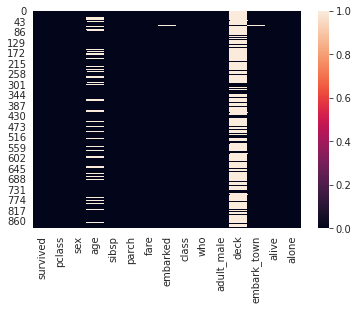
Plots the data as a heatmap to show missing values.

plot_missing(data=None):
   '''
    Parameters
    ------------
        data: DataFrame, array, or list of arrays.
            The data to plot.
 '''

Examples

We are using the titanic data set and a Jupyter notebook in the following examples.

plot_missing is created for every column in a DataFrame:

import pandas as pd
import datasist.visualizations as vs

df = pd.read_csv('titanic.csv')
vs.plot_missing(data=df)

Last updated