plot_scatter_shape

Description

Makes a scatter plot of data using shape_col as seperation.

plot_scatter_shape(data=None, 
                    cols=None, 
                    shape_col='', 
                    col_y='', 
                    alpha=0.2):
   '''
    Parameters
    ------------
        data: Dataframe 
            The data that is being imported using pandas.

        cols: list 
            The chosen number of columns in the DataFrame.

        shape_col: 
            The categorical column you want it to show as legend.

        col_y: The y axis of the plot
 '''

Examples

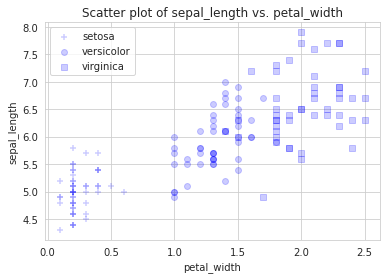
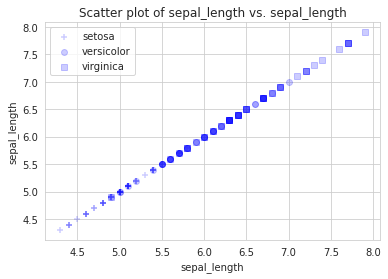
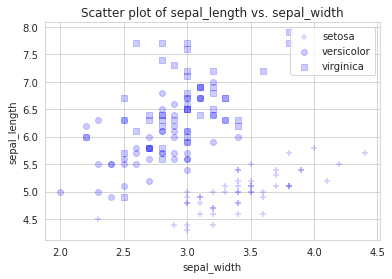
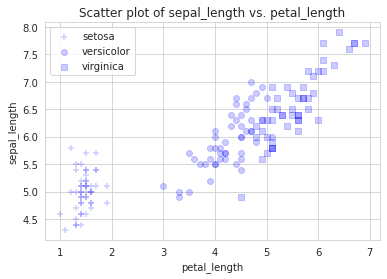
We are using the classic iris data set and a Jupyter notebook in the following examples.

plot_scatter_shape can be created for every column in a DataFrame:

import pandas as pd
import datasist.visualizations as vs

df = pd.read_csv('iris.csv')
vs.plot_scatter_shape(data = df, cols = ['sepal_length','sepal_width','petal_length','petal_width'], shape_col = 'species', col_y = 'sepal_length', alpha = 0.2)

plot_scatter_shape can be created for specified columns only:

vs.plot_scatter_shape(data = df, cols = ['sepal_width'], shape_col = 'species', col_y = 'sepal_length')

Last updated