boxplot

Makes a box plot of all numerical features against a specified categorical target column.

Description

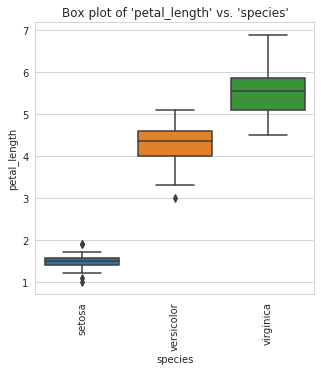
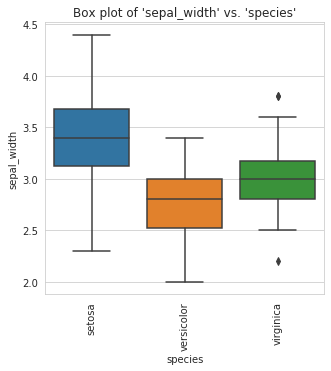
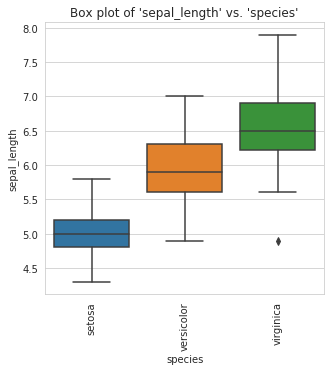
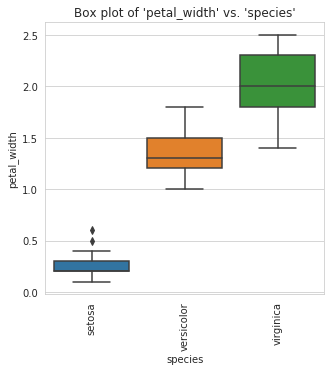
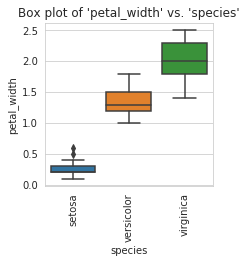
A box plot (or box-and-whisker plot) shows the distribution of quantitative data in a way that facilitates comparisons between variables or across levels of a categorical variable. The box shows the quartiles of the dataset while the whiskers extend to show the rest of the distribution, except for points that are determined to be "outliers" using a method that is a function of the inter-quartile range.

boxplot(data=None,
           num_features=None, 
           target=None,
           fig_size=(5,5),
           large_data=False
           save_fig=False):
   '''
    Parameters
    ------------
        data : DataFrame, array, or list of arrays.
            Dataset for plotting.
            
        num_features: Scalar, array, or list. 
            The numerical features in the dataset, if not None, 
            we try to infer the numerical columns from the dataframe.
       
         target: array, pandas series, list.
            A categorical target column. Maximun number of categories is 10 and minimum is 1
        
        fig_size: tuple, Default (8,8)
            The size of the figure object.
        
        large_data: bool, Default False.
            If True, then sns boxenplot is used instead of normal boxplot. Boxenplot is 
            better for large dataset.
        
        save_fig: bool, Default False.
            If True, saves the current plot to the current working directory
 '''

Examples

We are using the classic iris data set and a Jupyter notebook in the following examples.

Boxplots can be created for every column in a DataFrame and separated by a specified target:

import pandas as pd
import datasist.visualizations as vs

df = pd.read_csv('iris.csv')
vs.boxplot(data=df, target='species')

boxplot can be created for specified columns only:

vs.boxplot(data=df,num_features=['petal_width'],target='species')

The size of plots can changed using the fig_size parameter

vs.boxplot(data=df,
              num_features=['petal_width'],
              fig_size=(3,3),
              target='species')

To save a figure to the current working directory, set the save_fig parameter to True:

vs.boxplot(data=df,
              num_features=['petal_width'],
              target='species', 
              save_fig=True)

For large dataset (in orders of millions), it is recommended to set the large_data parameter to True. This tells boxplot to use an efficient method of plotting called the boxenplot

Learn more about boxenplot here

To improve this documentation, visit the datasist-doc repository

Last updated