Makes a scatter plot of numerical features against a numerical target. Helps to show the relationship between features.
scatterplot(data=None, num_features=None, target=None, separate_by=None, fig_size=(5,5), save_fig=False):''' Parameters ------------ data : DataFrame, array, or list of arrays. The data to plot. num_features: int/floats, scalar, array, or list. The numeric features in the dataset, if not provided, we try to infer the numeric columns from the dataframe. target: int/float, scalar, array or list. Numerical target feature to plot against. separate_by: str, default None. The feature used to seperate the plot. Called hue in seaborn. fig_size: tuple, Default (10,10) The size of the figure object. save_fig: bool, Default False. Saves the plot to the current working directory '''
Examples
We are using the classic iris data set and a Jupyter notebook in the following examples.
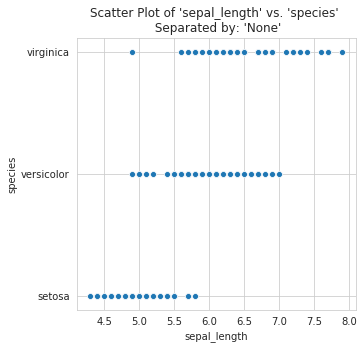
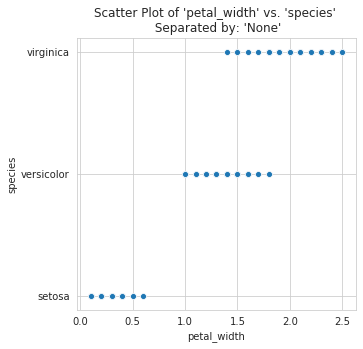
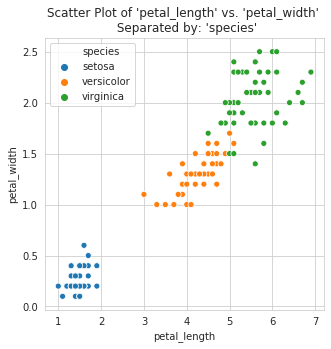
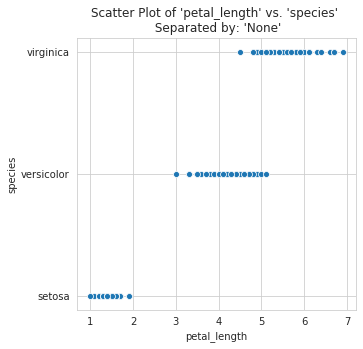
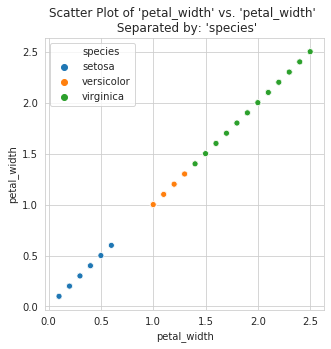
Scatterplots can be created for every column in a DataFrame and separated by a specified target:
import pandas as pdimport datasist as ds #import datasist librarydf = pd.read_csv('iris.csv')vs.scatterplot(data=df, target='species')
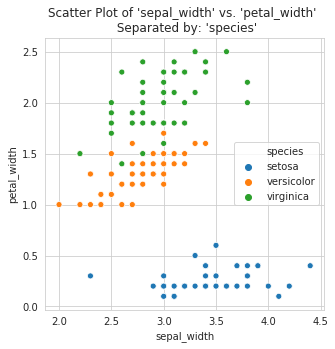
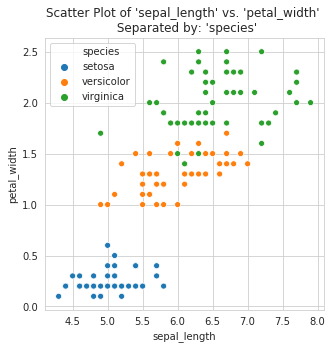
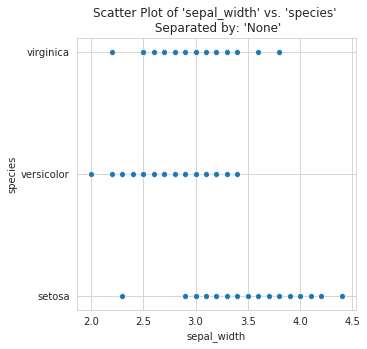
A scatterplot can separated by a categorical target: